

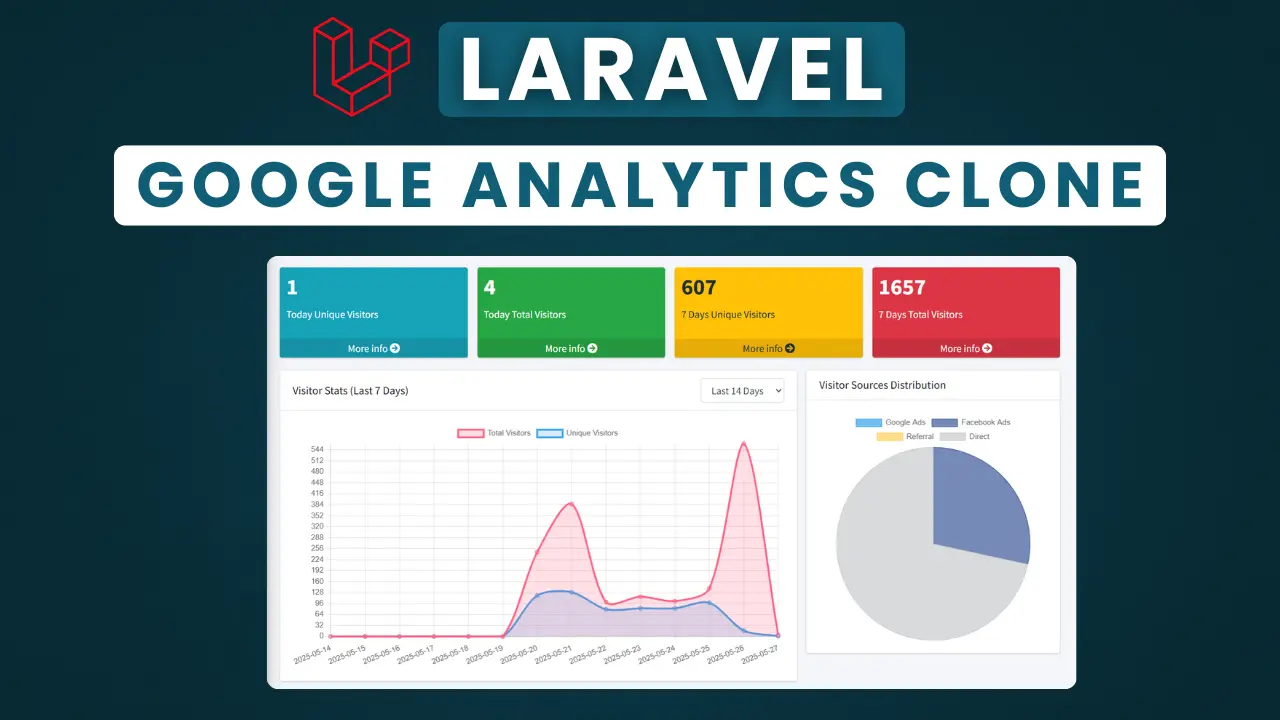
Creating a Custom Google Analytics Clone in Laravel: Track Website Traffic Like a Pro
In this comprehensive guide, I'll show you how to build your own custom analytics solution in Laravel to track website traffic, complete with dashboards, visitor logs, and detailed reporting - just like Google Analytics but tailored to your needs.
Why Build Your Own Analytics Solution?
Before we dive into the code, let's understand why you might want to create your own analytics system:
-
Data Ownership - You own all your traffic data completely
-
Customization - Tailor metrics to your specific business needs
-
Privacy Compliance - Avoid third-party cookies and tracking issues
-
Cost Effective - No premium subscription fees
-
Integration - Seamlessly connects with your existing Laravel application
Prerequisites
Before starting, make sure you have:
-
An existing Laravel application (version 8.x or higher recommended)
-
Composer installed on your system
-
Basic knowledge of Laravel and PHP
Step 1: Set Up Admin Panel (If You Don't Have One)
If your Laravel app doesn't already have an admin panel, I recommend using Laravel-AdminLTE, a popular admin panel template:
composer require jeroennoten/laravel-adminlte
Follow the installation instructions from the official package documentation or watch my YouTube tutorial video for a visual guide.
Step 2: Install Visitor Tracking Package
We'll use the shetabit/visitor package for core tracking functionality:
composer require shetabit/visitor
Now publish the package's configuration and migration files:
php artisan vendor:publish --provider="Shetabit\Visitor\Provider\VisitorServiceProvider"
Run the migrations to create the necessary tables:
php artisan migrate
Step 3: Implement Tracking on Frontend Pages
Add visitor tracking to your frontend controllers by adding this to the constructor of each controller handling your public pages:
public function __construct()
{
    // method to save visitor by package: https://github.com/shetabit/visitor
    visitor()->visit();
}
This will automatically track:
-
Visitor IP
-
Browser and device info
-
Visit time and duration
-
Referring URLs
-
And more
Step 4: Create Visitor Controller
Create a new controller to handle visitor data:
php artisan make:controller VisitorController
Here's the complete controller code:
<?php

namespace App\Http\Controllers;

use App\Models\Visitor;
use Illuminate\Http\Request;
use Illuminate\Support\Facades\DB;
use Shetabit\Visitor\Models\Visit;

class VisitorController extends Controller
{
    /**
     * Display a listing of the resource.
     */
    public function index()
    {
      // Get the latest visit entry per IP
        $latestVisits = Visit::select('id', 'ip', 'url', 'created_at')
            ->orderByDesc('created_at')
            ->get()
            ->unique('ip') // keep only one per IP
            ->values();

        // Get total visit counts grouped by IP
        $visitCounts = Visit::select('ip', DB::raw('COUNT(*) as visit_count'))
            ->groupBy('ip')
            ->pluck('visit_count', 'ip'); // [ip => count]

        // Merge count into the latestVisits
        $visitors = $latestVisits->map(function ($visit) use ($visitCounts) {
            $visit->visit_count = $visitCounts[$visit->ip] ?? 0;
            return $visit;
        });
        return view('visitors', compact('visitors'));
    }


    public function show(Visitor $visitor,$ip)
    {
           // Get all visit entries for the given IP (paginated if needed)
       $visits = Visit::where('ip', $ip)->get(); // Eloquent Collection


        return view('visitor-detail', compact('visits', 'ip'));
    }

}
Step 5: Create Views for Visitor Data
Visitors List View (resources/views/visitors.blade.php)
@extends('adminlte::page')
@section('css')
    <link rel="stylesheet" href="/css/admin_custom.css">
    <style>
        .wrap-text {
            word-break: break-all;
            white-space: normal;
        }
    </style>
@stop

@section('title', 'Dashboard')

@section('content_header')
    <h1>All Visitors</h1>
@stop

@section('content')
    <section class="content">
        <div class="container-fluid">
            <div class="row">
                <div class="col-12">
                    <div class="card">
                        <div class="card-header">
                            <h3 class="card-title">List of all visitors</h3>
                        </div>
                        <div class="card-body">
                            <div id="example1_wrapper" class="dataTables_wrapper dt-bootstrap4">
                                <div class="row">
                                    <div class="col-sm-12">
                                        <table id="example1"
                                            class="table table-bordered table-striped dataTable dtr-inline collapsed"
                                            role="grid" aria-describedby="example1_info">
                                            <thead>
                                                <tr role="row">
                                                    <th>#</th>
                                                    <th>IP</th>
                                                    <th>URL</th>
                                                    <th>Visit Count</th>
                                                    <th>Date</th>
                                                    <th>Action</th>
                                                </tr>
                                            </thead>
                                            <tbody>
                                                @foreach ($visitors as $visitor)
                                                    <tr class="odd">
                                                        <td>{{ $loop->iteration }}</td>
                                                        <td>{{ $visitor->ip }}</td>
                                                        <td class="wrap-text">{{ $visitor->url }}</td>
                                                        <td>{{ $visitor->visit_count }}</td>
                                                        <td>{{ $visitor->created_at }}</td>
                                                        <td>
                                                            <a href="{{ route('visitorDetail', $visitor->ip) }}"
                                                                class="btn btn-sm btn-primary">View</a>
                                                        </td>
                                                    </tr>
                                                @endforeach
                                            </tbody>
                                            <tfoot>
                                                <tr>
                                                    <th>IP</th>
                                                    <th>Visit Count</th>
                                                    <th>Date</th>
                                                    <th>Action</th>
                                                </tr>
                                            </tfoot>
                                        </table>
                                    </div>
                                </div>
                            </div>
                        </div>
                    </div>
                </div>
            </div>
        </div>
    </section>
@stop

@section('js')
<script>
    $(function() {
        $('#example1').DataTable({
            order: [
                [0, 'asc']
            ],
            pageLength: 100
        });
    });
</script>
@stop
Visitor Detail View (resources/views/visitor-detail.blade.php)
@extends('adminlte::page')

@section('title', 'Visitor Details')

@section('content_header')
    <h1>Details for IP: {{ $ip }}</h1>
@stop
@section('css')
 <style>
    .wrap-text {
        max-width: 300px;
        word-break: break-word;
        white-space: normal;
        overflow-wrap: break-word;
    }

    /* Optional: Make table scrollable on small screens */
    .table-responsive {
        overflow-x: auto;
    }
</style>
@stop
@section('content')
    <div class="card">
        <div class="card-header">
            <h3 class="card-title">Visit Logs for: {{ $ip }}</h3>
            <small class="ml-3 text-bold">Total Visits: {{ $visits->count() }}</small>
        </div>
        <div class="card-body p-0">
            <table class="table table-striped">
                <thead>
                    <tr>
                        <th>Device</th>
                        <th>Browser</th>
                        <th>URL</th>
                        <th>Previous URL</th>
                        <th>Status</th>
                        <th>Paid Search</th>
                        <th>Visited At</th>
                    </tr>
                </thead>
                <tbody>
                    @forelse ($visits as $visitor)
                        <tr>
                            <td><b>{{ $visitor->device }}</b></td>
                            <td>{{ $visitor->browser }}</td>
                            <td class="wrap-text">{{ $visitor->url }}</td>
                            <td class="wrap-text">{{ $visitor->previous_url ?? 'N/A' }}</td>
                            <td>
                                  @if($visitor->is_robot)
                                <span class="badge badge-danger">Robot</span>
                            @else
                                <span class="badge badge-success">Human</span>
                            @endif
                            </td>

                            <td class="wrap-text">
                                @php
                                    $url = $visitor->url;
                                    $parsedUrl = parse_url($url);
                                    $query = $parsedUrl['query'] ?? '';
                                    parse_str($query, $params);

                                    if (isset($params['gclid'])) {
                                        $source = 'Google Ads';
                                        $badgeClass = 'badge-primary';
                                    } elseif (isset($params['fbclid'])) {
                                        $source = 'Facebook Ads';
                                        $badgeClass = 'badge-info';
                                    } elseif (!empty($visitor->referrer)) {
                                        $source = 'Referral';
                                        $badgeClass = 'badge-warning';
                                    } else {
                                        $source = 'Direct';
                                        $badgeClass = 'badge-secondary';
                                    }
                                @endphp

                        <span class="badge {{ $badgeClass }}">
                            {{ $source }}
                        </span>
                    </td>

                            <td>{{ $visitor->created_at->format('Y-m-d H:i:s') }}</td>
                        </tr>
                    @empty
                        <tr>
                            <td colspan="7" class="text-center">No visits found for this IP.</td>
                        </tr>
                    @endforelse
                </tbody>
            </table>
        </div>
    </div>
@stop
Step 6: Add Routes
Add these routes to your routes/web.php file:
Route::get('/dashboard', [App\Http\Controllers\DashboardController::class, 'dashboard'])->name('dashboard');
Route::get('/visitors', [App\Http\Controllers\VisitorController::class, 'index'])->name('visitors');
Route::get('/visitors/ip/{ip}', [App\Http\Controllers\VisitorController::class, 'show'])->name('visitorDetail');
Step 7: Create Dashboard Controller and View
Create a dashboard controller to show analytics data:
php artisan make:controller DashboardController
Here's the complete controller code:
<?php

namespace App\Http\Controllers;

use App\Models\Visitor;
use Illuminate\Http\Request;
use Carbon\Carbon;
use Illuminate\Support\Facades\DB;
use Shetabit\Visitor\Models\Visit;

class DashboardController extends Controller
{
    public function dashboard(Request $request)
    {
        $days = $request->get('days', '7');

        if ($days === 'today') {
            $startDate = now()->startOfDay();
            $visits = Visit::where('created_at', '>=', $startDate)->get();

            // Only one day label for today
            $labels = [now()->format('Y-m-d')];
            $allVisits = $visits->count();
            $uniqueVisits = $visits->unique('ip')->count();

            $totalData = [$allVisits];
            $uniqueData = [$uniqueVisits];

            // For summary boxes (today = all the data)
            $todayUnique = $visits->unique('ip');
            $todayTotal = $visits;

            // For 7 days counts fallback (or set to 0 or empty)
            $sevenUniqueCount = 0;
            $sevenTotalCount = 0;
        } else {
            $days = (int) $days;
            $startDate = now()->subDays($days - 1)->startOfDay();
            $visits = Visit::where('created_at', '>=', $startDate)->get();

            // Group by day, etc.
            $allVisitsGrouped = $visits->groupBy(function($item) {
                return $item->created_at->format('Y-m-d');
            })->map->count();

            $uniqueVisitsGrouped = $visits->groupBy(function($item) {
                return $item->created_at->format('Y-m-d');
            })->map(function($group) {
                return $group->unique('ip')->count();
            });

            $labels = [];
            $totalData = [];
            $uniqueData = [];

            for ($i = 0; $i < $days; $i++) {
                $date = now()->subDays($days - 1 - $i)->format('Y-m-d');
                $labels[] = $date;
                $totalData[] = $allVisitsGrouped[$date] ?? 0;
                $uniqueData[] = $uniqueVisitsGrouped[$date] ?? 0;
            }

            $todayUnique = $visits->where('created_at', '>=', now()->startOfDay())->unique('ip');
            $todayTotal = $visits->where('created_at', '>=', now()->startOfDay());

            $sevenUniqueCount = $uniqueVisitsGrouped->sum();
            $sevenTotalCount = $allVisitsGrouped->sum();
        }

        // Visitor source counts for selected visits
        $sourceCounts = [
            'Google Ads' => 0,
            'Facebook Ads' => 0,
            'Referral' => 0,
            'Direct' => 0,
        ];

        foreach ($visits as $visit) {
            $url = $visit->url;
            $parsedUrl = parse_url($url);
            $query = $parsedUrl['query'] ?? '';
            parse_str($query, $params);

            if (isset($params['gclid'])) {
                $sourceCounts['Google Ads']++;
            } elseif (isset($params['fbclid'])) {
                $sourceCounts['Facebook Ads']++;
            } elseif (!empty($visit->referrer)) {
                $sourceCounts['Referral']++;
            } else {
                $sourceCounts['Direct']++;
            }
        }

        $sourceLabels = array_keys($sourceCounts);
        $sourceData = array_values($sourceCounts);

        return view('dashboard', compact(
            'labels', 'totalData', 'uniqueData',
            'todayUnique', 'todayTotal',
            'sevenUniqueCount', 'sevenTotalCount',
            'sourceLabels', 'sourceData',
            'days'
        ));
    }
}
Dashboard View (resources/views/dashboard.blade.php)
@extends('adminlte::page')

@section('title', 'Dashboard')

@section('content_header')
    <h1>Dashboard</h1>
@stop

@section('content')
    <section class="content">
        <div class="container-fluid">
            <!-- Small boxes (Stat box) -->
            <div class="row">
                <div class="col-lg-3 col-6">
                    <!-- small box -->
                    <div class="small-box bg-info">
                        <div class="inner">
                            <h3>{{ $todayUnique->count() }}</h3>
                            <p>Today Unique Visitors</p>
                        </div>
                        <div class="icon">
                            <i class="ion ion-bag"></i>
                        </div>
                        <a href="{{ route('visitors') }}" class="small-box-footer">More info <i
                                class="fas fa-arrow-circle-right"></i></a>
                    </div>
                </div>

                <div class="col-lg-3 col-6">
                    <!-- small box -->
                    <div class="small-box bg-success">
                        <div class="inner">
                            <h3>{{ $todayTotal->count() }}</h3>
                            <p>Today Total Visitors</p>
                        </div>
                        <div class="icon">
                            <i class="ion ion-stats-bars"></i>
                        </div>
                        <a href="{{ route('visitors') }}" class="small-box-footer">More info <i
                                class="fas fa-arrow-circle-right"></i></a>
                    </div>
                </div>

                <div class="col-lg-3 col-6">
                    <!-- small box -->
                    <div class="small-box bg-warning">
                        <div class="inner">
                            <h3>{{ $sevenUniqueCount }}</h3>
                            <p>7 Days Unique Visitors</p>
                        </div>
                        <div class="icon">
                            <i class="ion ion-person-add"></i>
                        </div>
                        <a href="{{ route('visitors') }}" class="small-box-footer">More info <i
                                class="fas fa-arrow-circle-right"></i></a>
                    </div>
                </div>

                <div class="col-lg-3 col-6">
                    <!-- small box -->
                    <div class="small-box bg-danger">
                        <div class="inner">
                            <h3>{{ $sevenTotalCount }}</h3>
                            <p>7 Days Total Visitors</p>
                        </div>
                        <div class="icon">
                            <i class="ion ion-pie-graph"></i>
                        </div>
                        <a href="#" class="small-box-footer">More info <i class="fas fa-arrow-circle-right"></i></a>
                    </div>
                </div>
            </div>

            <!-- Charts row -->
            <div class="row">
                <!-- Left: Line chart for daily visitors -->
                <div class="col-lg-8">
                    <div class="card">
                        <div class="card-header d-flex justify-content-between align-items-center">
                            <h3 class="card-title" id="chartTitle">Visitor Stats (Last 7 Days)</h3>
                            <select id="dateRangeSelector" class="form-control w-auto ml-auto">
                                <option value="today" {{ request('days', '7') === 'today' ? 'selected' : '' }}>Today
                                </option>
                                <option value="7" {{ request('days', '7') === '7' ? 'selected' : '' }}>Last 7 Days
                                </option>
                                <option value="14" {{ request('days') === '14' ? 'selected' : '' }}>Last 14 Days
                                </option>
                                <option value="30" {{ request('days') === '30' ? 'selected' : '' }}>Last 1 Month
                                </option>
                                <option value="365" {{ request('days') === '365' ? 'selected' : '' }}>Last 1 Year
                                </option>
                            </select>
                        </div>
                        <div class="card-body">
                            <canvas id="dailyUsersChart" height="150"></canvas>
                        </div>
                    </div>
                </div>

                <!-- Right: Pie chart for visitor sources -->
                <div class="col-lg-4">
                    <div class="card">
                        <div class="card-header">
                            <h3 class="card-title">Visitor Sources Distribution</h3>
                        </div>
                        <div class="card-body">
                            <canvas id="sourcePieChart" height="75"></canvas>
                        </div>
                    </div>
                </div>
            </div>
        </div>
    </section>
@stop

@section('css')
    <link rel="stylesheet" href="/css/admin_custom.css">
@stop

@section('js')
    <!-- Chart.js CDN -->
    <script src="https://cdn.jsdelivr.net/npm/chart.js"></script>

    <script>
        // Line Chart for Daily Visitors
        const dailyUsersChart = new Chart(document.getElementById('dailyUsersChart').getContext('2d'), {
            type: 'line',
            data: {
                labels: {!! json_encode($labels) !!},
                datasets: [{
                        label: 'Total Visitors',
                        data: {!! json_encode($totalData) !!},
                        borderColor: 'rgba(255, 99, 132, 1)',
                        backgroundColor: 'rgba(255, 99, 132, 0.2)',
                        fill: true,
                        tension: 0.3
                    },
                    {
                        label: 'Unique Visitors',
                        data: {!! json_encode($uniqueData) !!},
                        borderColor: 'rgba(54, 162, 235, 1)',
                        backgroundColor: 'rgba(54, 162, 235, 0.2)',
                        fill: true,
                        tension: 0.3
                    }
                ]
            },
            options: {
                responsive: true,
                scales: {
                    y: {
                        beginAtZero: true,
                        ticks: {
                            stepSize: 1
                        }
                    }
                }
            }
        });

        // Pie Chart for Visitor Sources
        const ctxPie = document.getElementById('sourcePieChart').getContext('2d');
        const sourcePieChart = new Chart(ctxPie, {
            type: 'pie',
            data: {
                labels: {!! json_encode($sourceLabels) !!},
                datasets: [{
                    data: {!! json_encode($sourceData) !!},
                    backgroundColor: [
                        'rgba(54, 162, 235, 0.7)', // Google Ads - Blue
                        'rgba(59, 89, 152, 0.7)', // Facebook Ads - Dark Blue
                        'rgba(255, 206, 86, 0.7)', // Referral - Yellow
                        'rgba(201, 203, 207, 0.7)' // Direct - Grey
                    ],
                    borderColor: [
                        'rgba(54, 162, 235, 1)',
                        'rgba(59, 89, 152, 1)',
                        'rgba(255, 206, 86, 1)',
                        'rgba(201, 203, 207, 1)'
                    ],
                    borderWidth: 1
                }]
            },
            options: {
                responsive: true
            }
        });
    </script>

    <script>
        document.getElementById('dateRangeSelector').addEventListener('change', function() {
            const days = this.value;
            let titleMap = {
                'today': 'Visitor Stats (Today)',
                '7': 'Visitor Stats (Last 7 Days)',
                '14': 'Visitor Stats (Last 14 Days)',
                '30': 'Visitor Stats (Last 1 Month)',
                '365': 'Visitor Stats (Last 1 Year)'
            };

            document.getElementById('chartTitle').textContent = titleMap[days] || 'Visitor Stats';

            // Reload page with ?days= selected value
            const url = new URL(window.location.href);
            url.searchParams.set('days', days);
            window.location.href = url.toString();
        });
    </script>
@stop
Conclusion
You've now built a powerful, custom analytics solution for your Laravel application that gives you complete control over your website traffic data. This system provides:
-
Detailed visitor tracking
-
Beautiful, interactive dashboards
-
Source attribution (Google Ads, Facebook, etc.)
-
Device and browser breakdowns
-
Custom reporting periods
The best part? You own all the data and can extend it in any direction your business needs.
For more Laravel tutorials and packages, check out my YouTube channel and GitHub profile.
Tags
Share :