

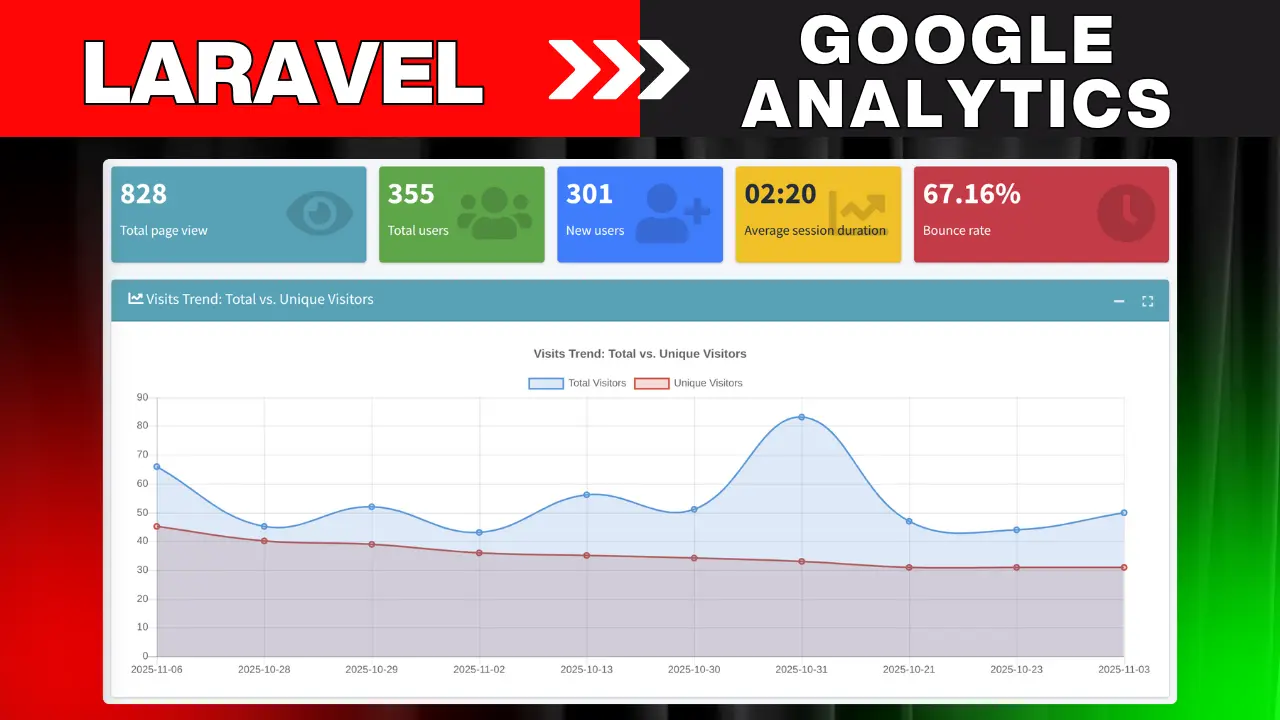
How to Add Google Analytics (GA4) to a Laravel Dashboard via Google API — Step-by-Step Guide
Adding Google Analytics data directly into your Laravel admin dashboard gives product and marketing teams instant insights without switching to the Google Analytics UI. This guide shows a full, search-friendly, step-by-step approach using Spatie’s laravel-analytics package (GA4 / Google Analytics Data API), a service account, and the ConsoleTVs Charts package for visualizations.
You’ll get:
-
required packages and PHP extensions,
-
how to obtain and secure Google credentials,
-
config and
.envsettings, -
a ready
DashboardControllerand Blade view, -
chart rendering tips and troubleshooting.
Prerequisites
-
Laravel 10/11/12 (or compatible)
-
Composer installed
-
Access to Google Cloud console (Google account)
-
Basic familiarity with routes, controllers, Blade
-
PHP extensions:
bcmath(common for chart libs),json,curl,openssl -
Optional: AdminLTE or similar admin template in your project
1. Install packages
Open terminal in your Laravel project root:
composer require spatie/laravel-analytics
composer require consoletvs/charts
Note: ConsoleTVs Charts may require certain Chart.js versions. If you see Call to undefined method ConsoleTVs\Charts\Classes\Chartjs\Dataset::script() or container(), verify the Charts package version and the tutorial examples you're using — the API changed across releases. If you get errors, consider matching the Charts package version to the tutorial (or use Chartisan / Chart.js directly).
Publish Spatie config:
php artisan vendor:publish --tag="analytics-config"
The following config file will be published in config/analytics.php
<?php

return [

    'property_id' => env('ANALYTICS_PROPERTY_ID'),

    'service_account_credentials_json' => storage_path('app/private/analytics/service-account-credentials.json'),

    'cache_lifetime_in_minutes' => 60 * 24,

    'cache' => [
        'store' => 'file',
    ],
];
Step 2: How to obtain the credentials to communicate with Google Analytics
Getting credentials
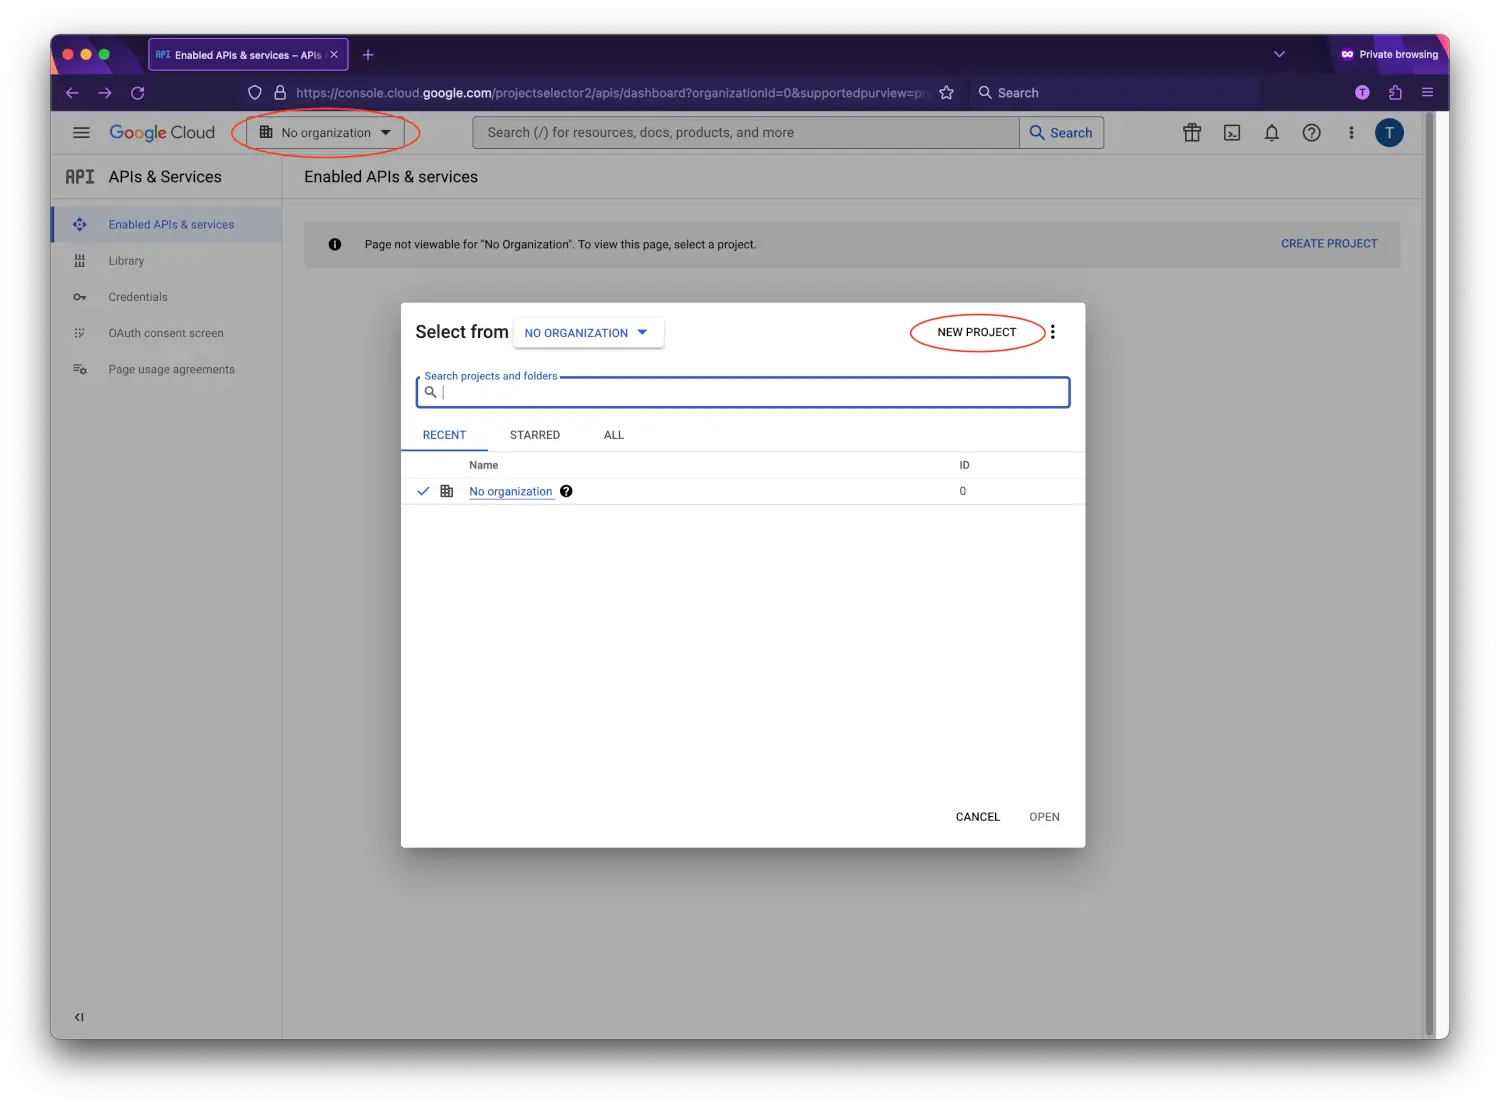
The first thing you’ll need to do is to get some credentials to use Google API’s. I’m assuming that you’ve already created a Google account and are signed in. Head over to Google API’s site and select or create a project.
Next up we must specify which API’s the project may consume. Go to the API Library and search for "Google Analytics Data API".

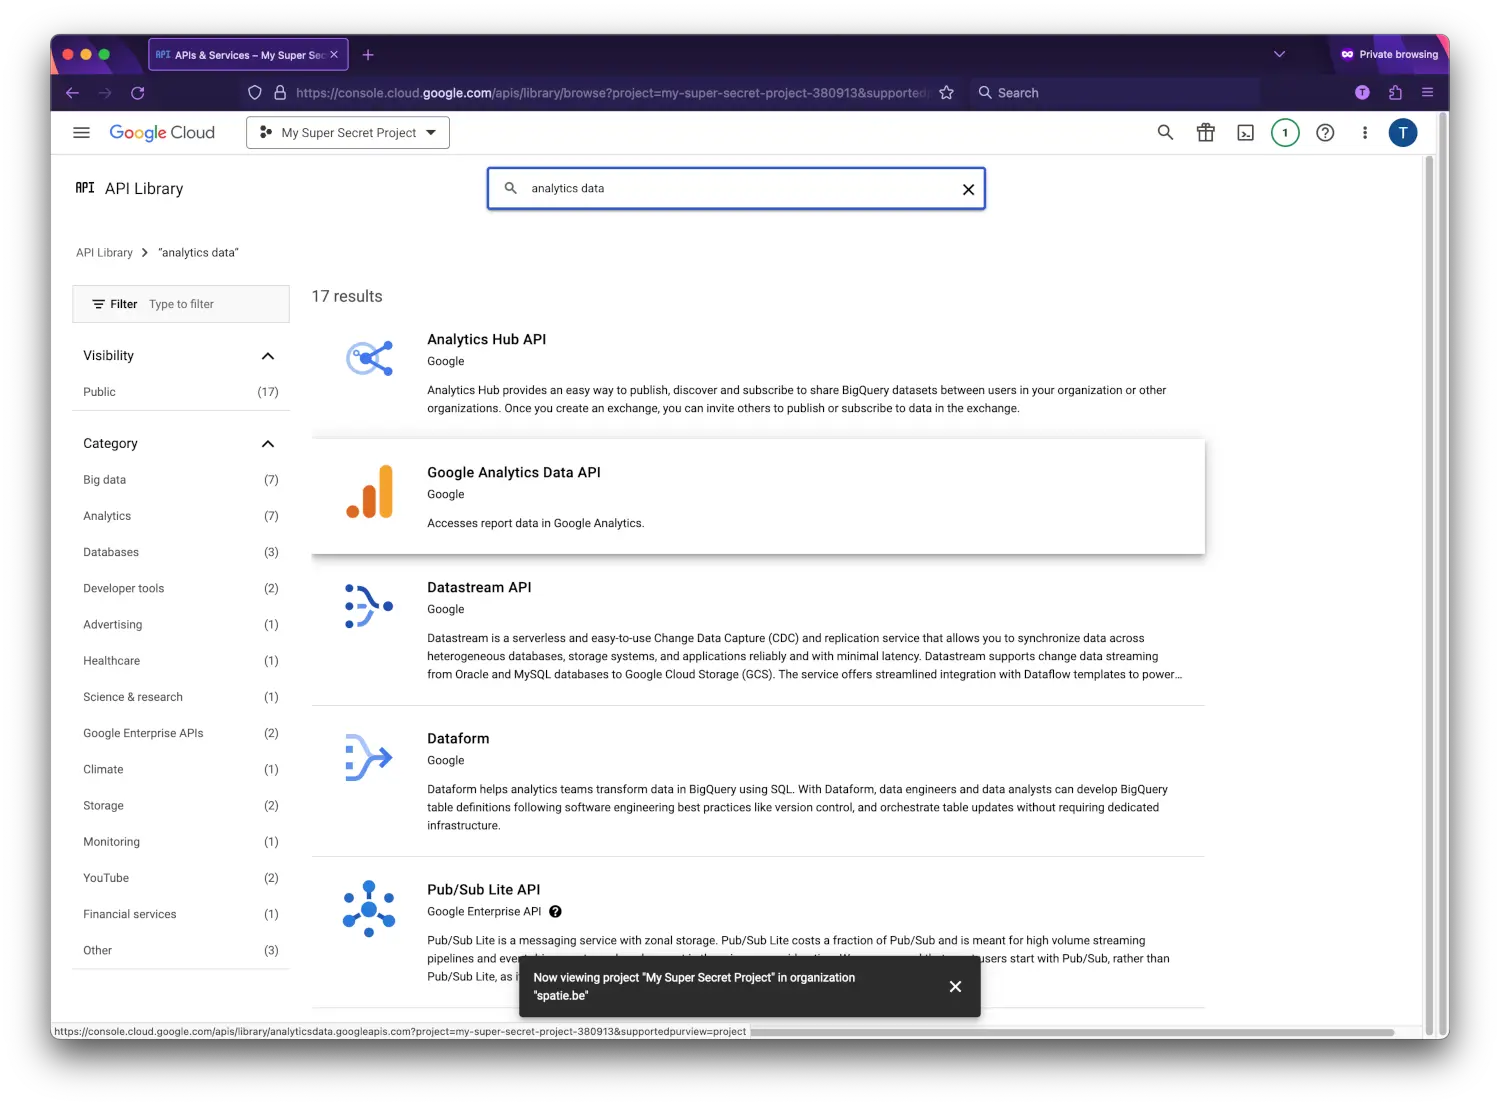 Choose enable to enable the API.
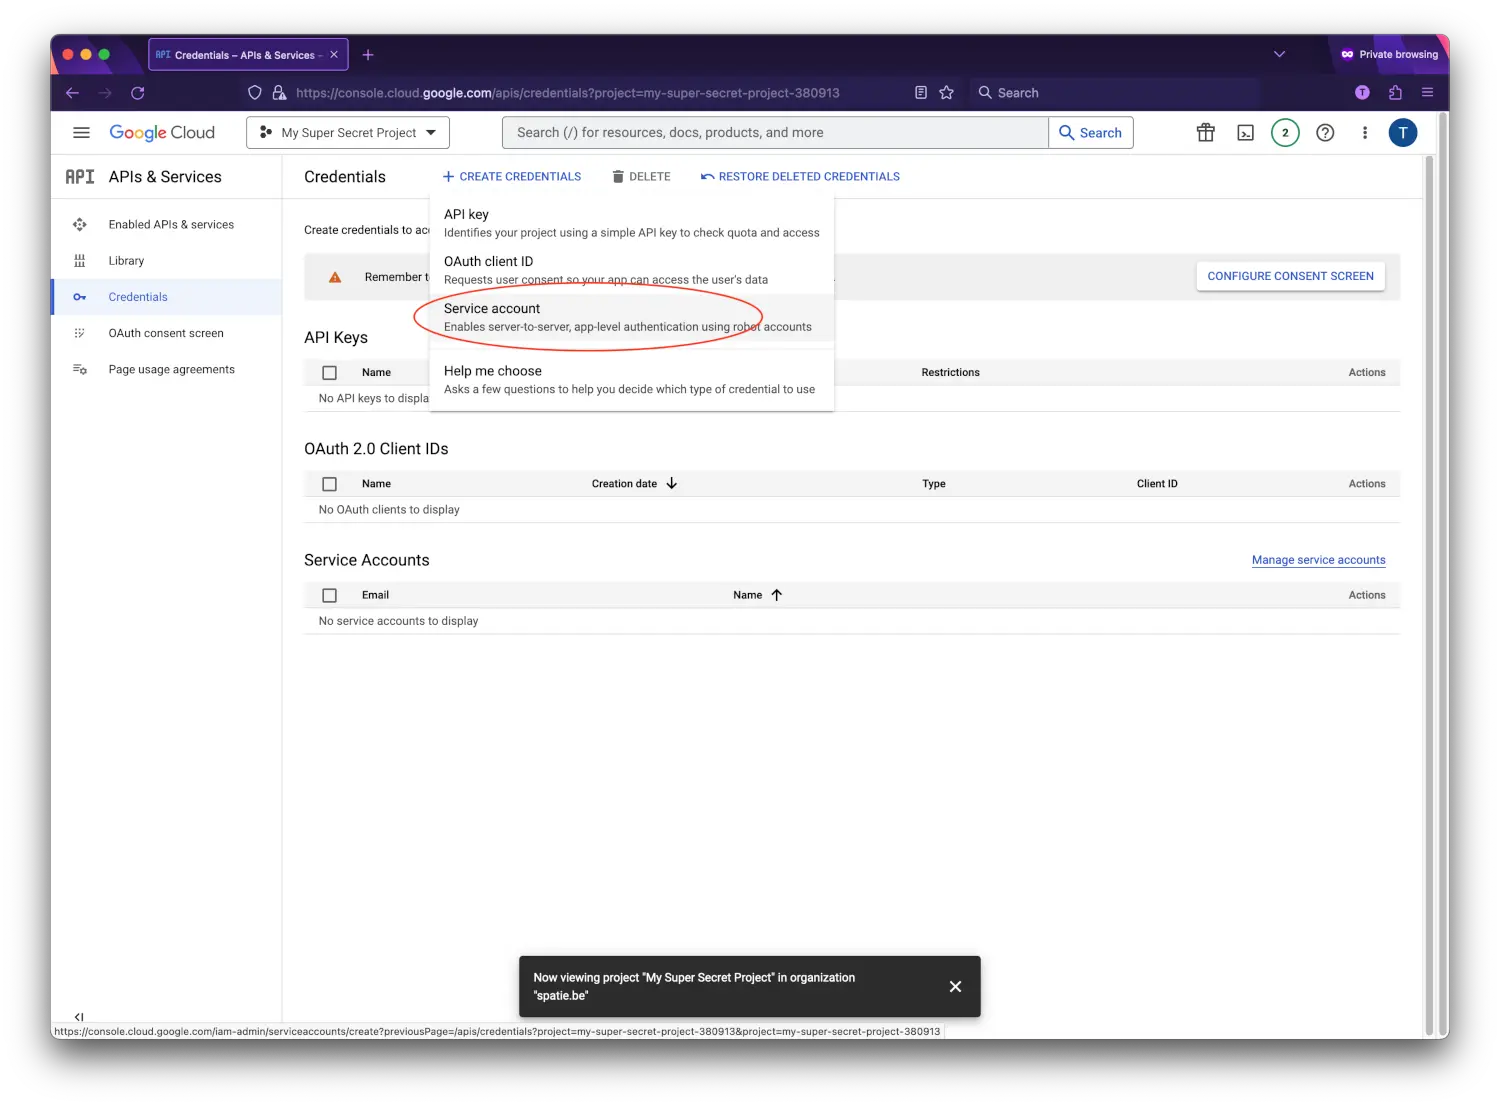
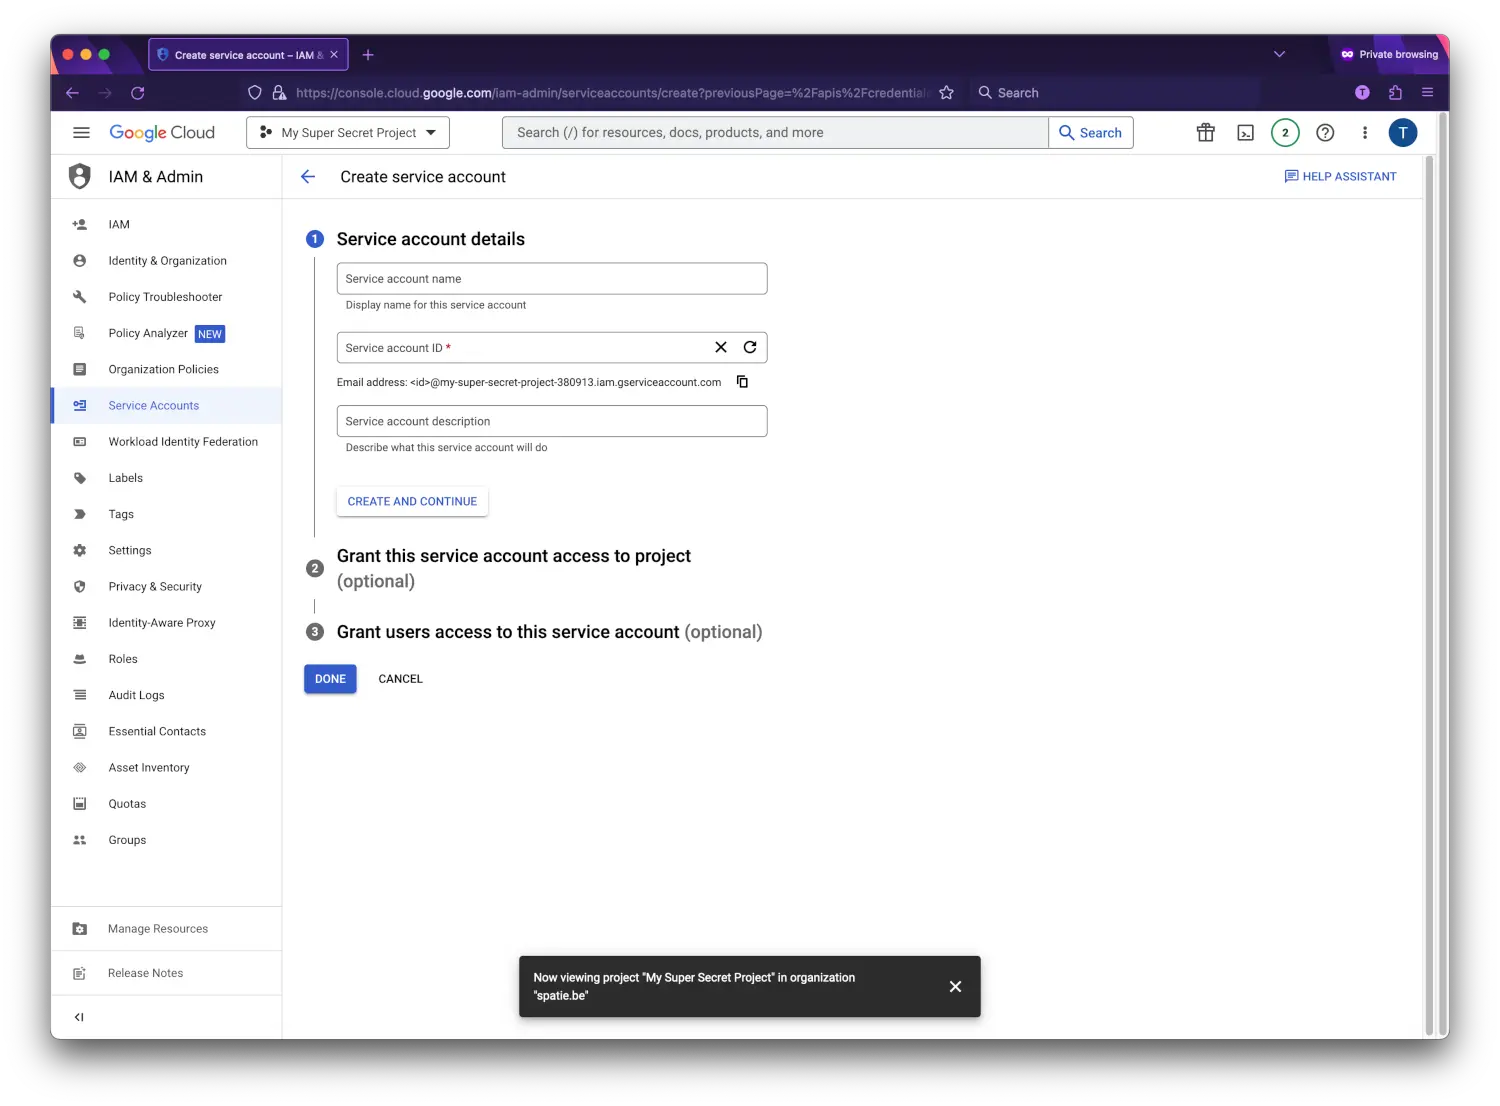
 Now that you’ve created a project that has access to the Analytics API it’s time to download a file with these credentials. Click "Credentials" in the sidebar. You’ll want to create a "Service account key".
 On the next screen you can give the service account a name. You can name it anything you’d like. In the service account id you’ll see an email address. We’ll use this email address later on in this guide.
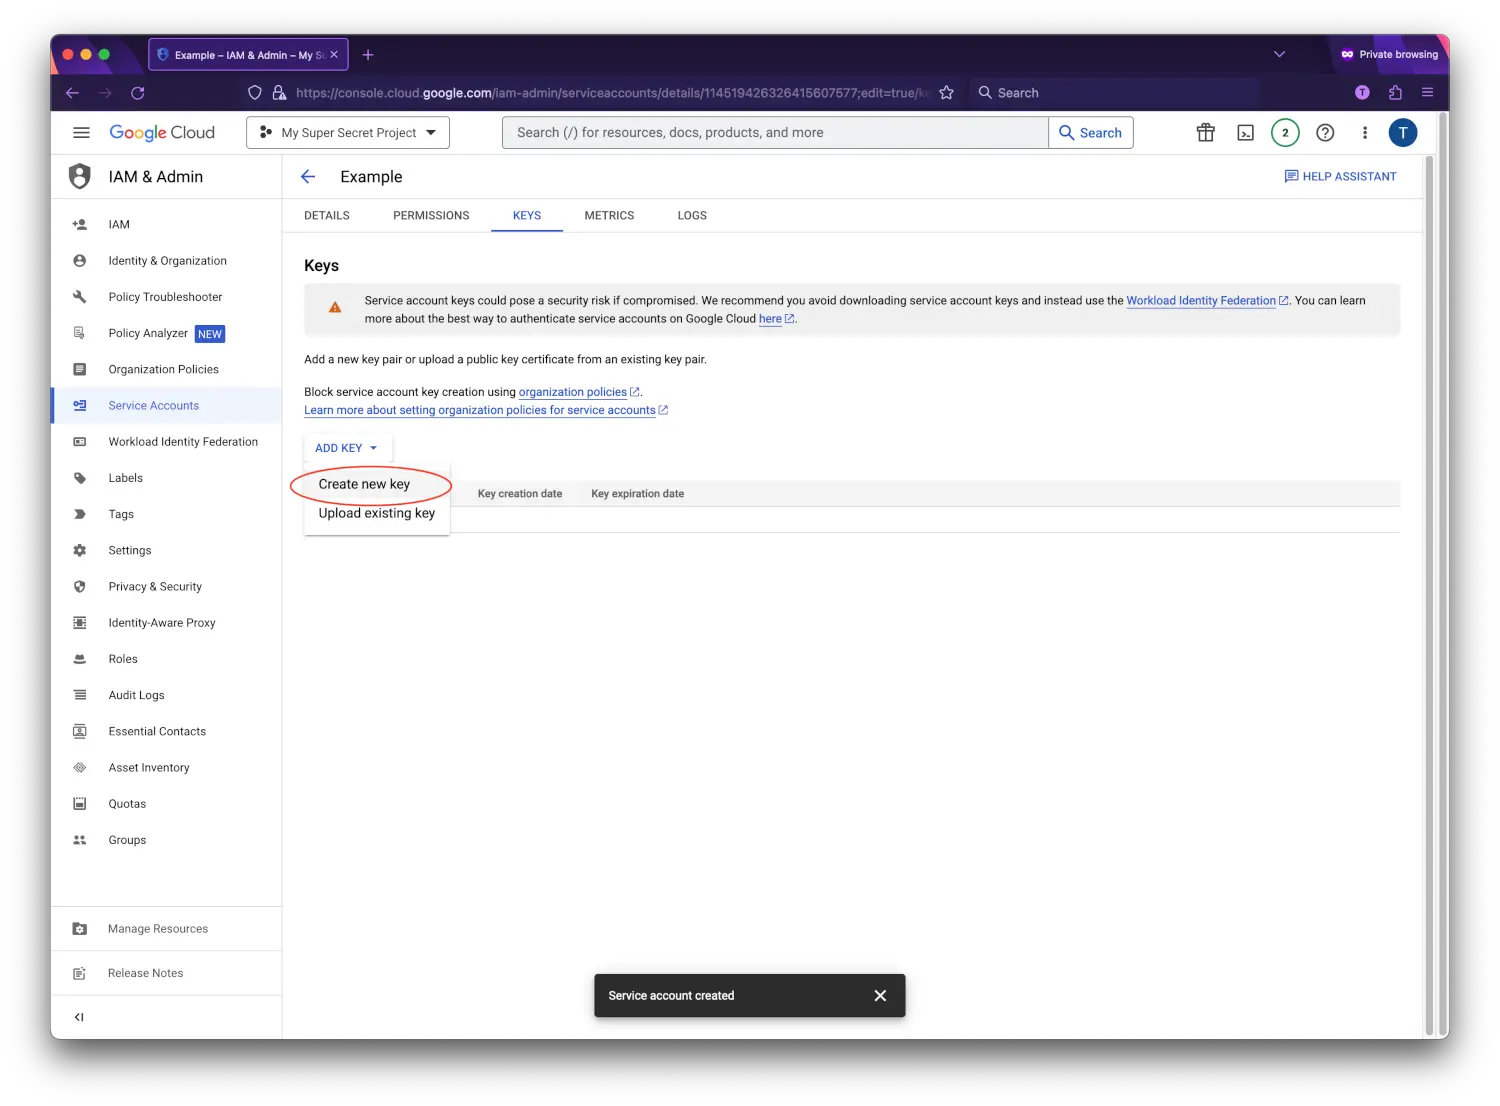
 Go to the details screen of your created service account and select "keys", from the "Add key" dropdown select "Create new key".
 Select "JSON" as the key type and click "Create" to download the JSON file.
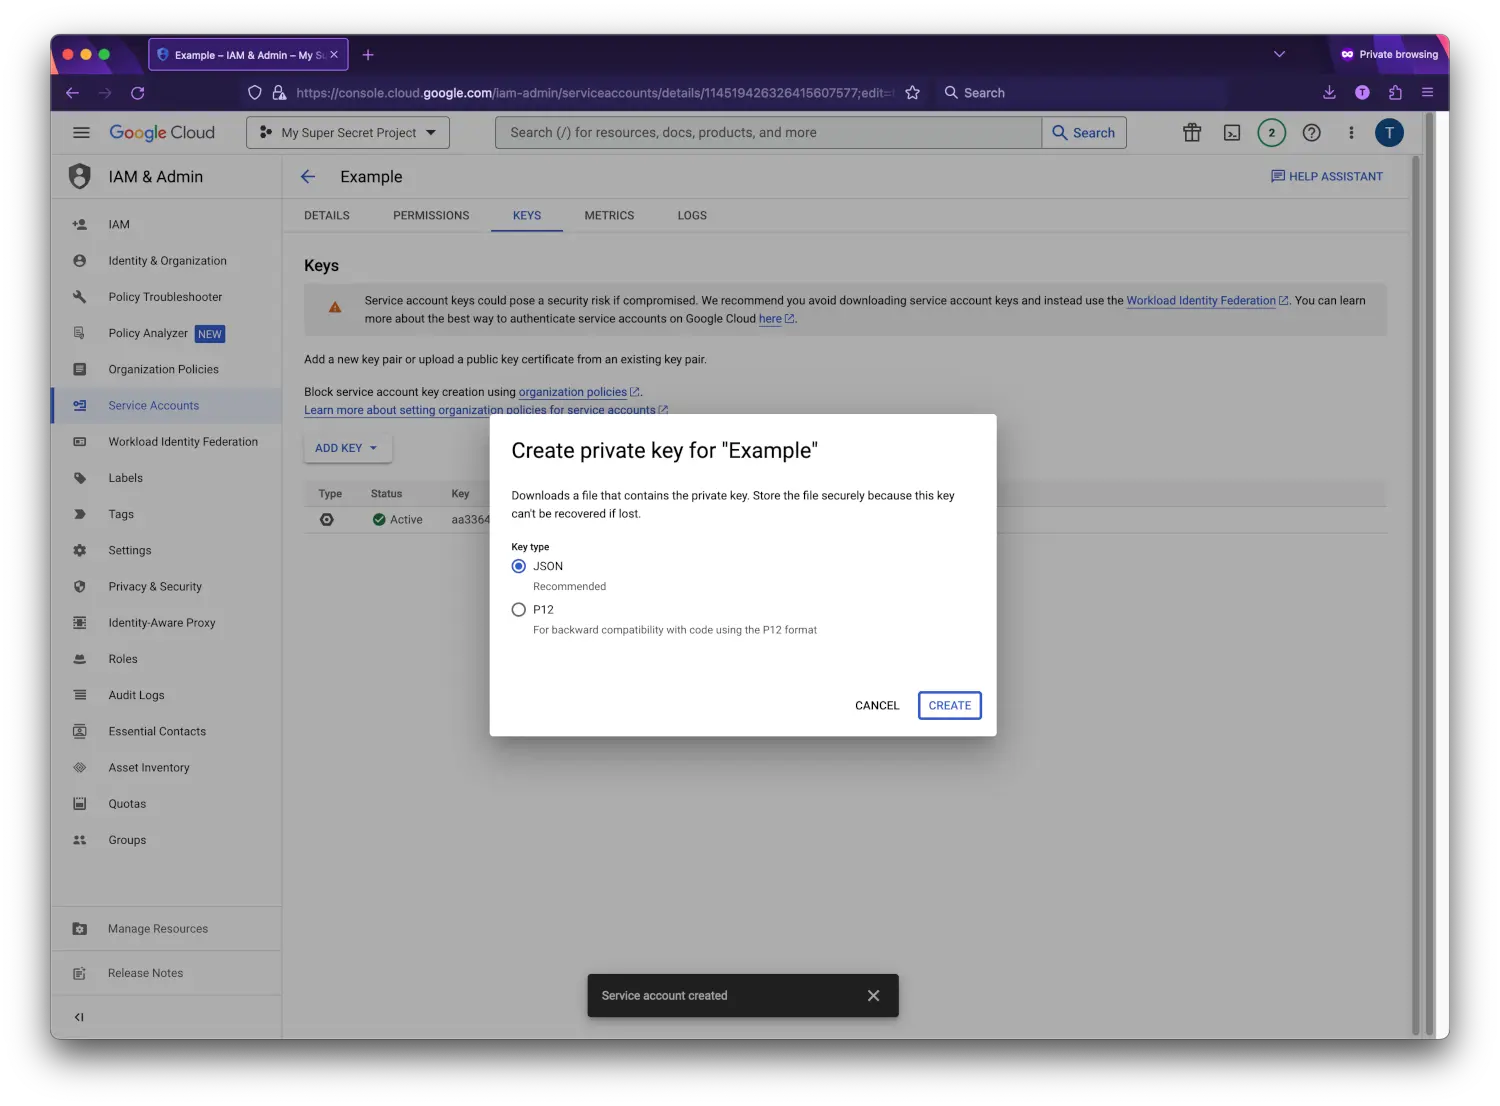
** Download the JSON file. Do not commit it to git.
Place the file inside Laravel storage, for example:
storage/app/private/analytics/service-account-credentials.json
NOTE: ALSO ADD GIT IGNORE IN FILE: .gitignore
/storage/app/private/analytics/*.json
Save the json inside your Laravel project at the location specified in the service_account_credentials_json key of the config file of this package. Because the json file contains potentially sensitive information I don't recommend committing it to your git repository.
Step 3: Granting permissions to your Analytics property
I'm assuming that you've already created a Analytics account on the Analytics site and are using the new GA4 properties.
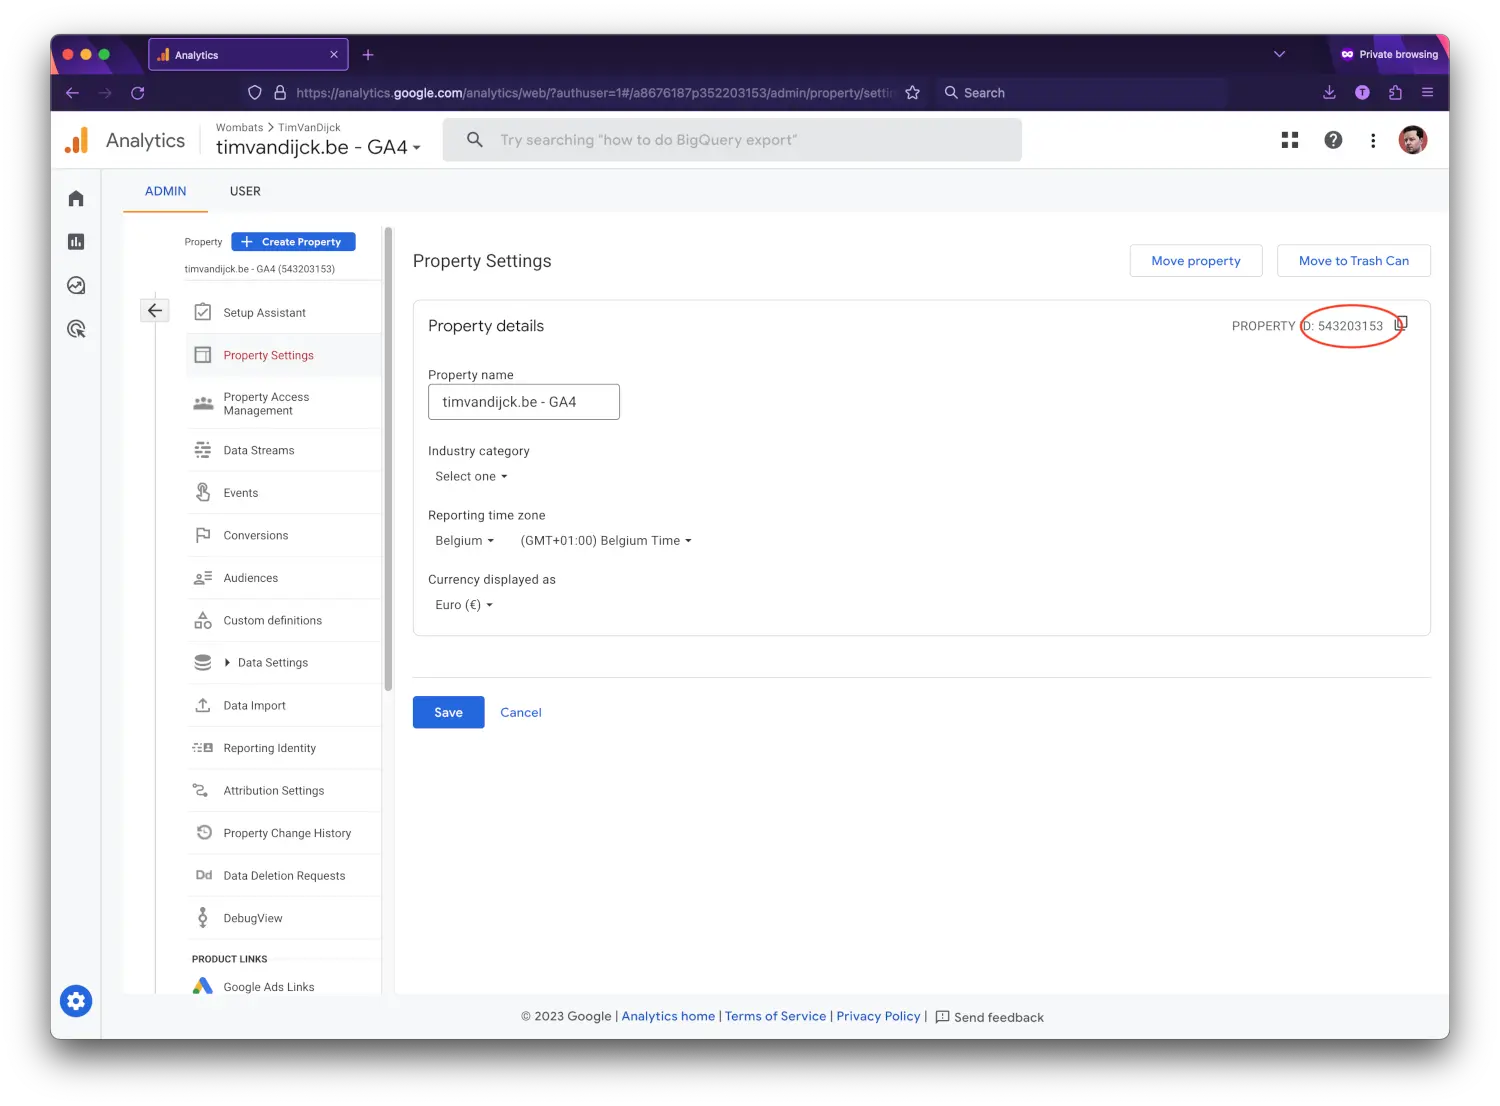
First you will need to know your property ID. In Analytics, go to Settings > Property Settings. Here you will be able to copy your property ID. Use this value for the ANALYTICS_PROPERTY_ID key in your .env file.
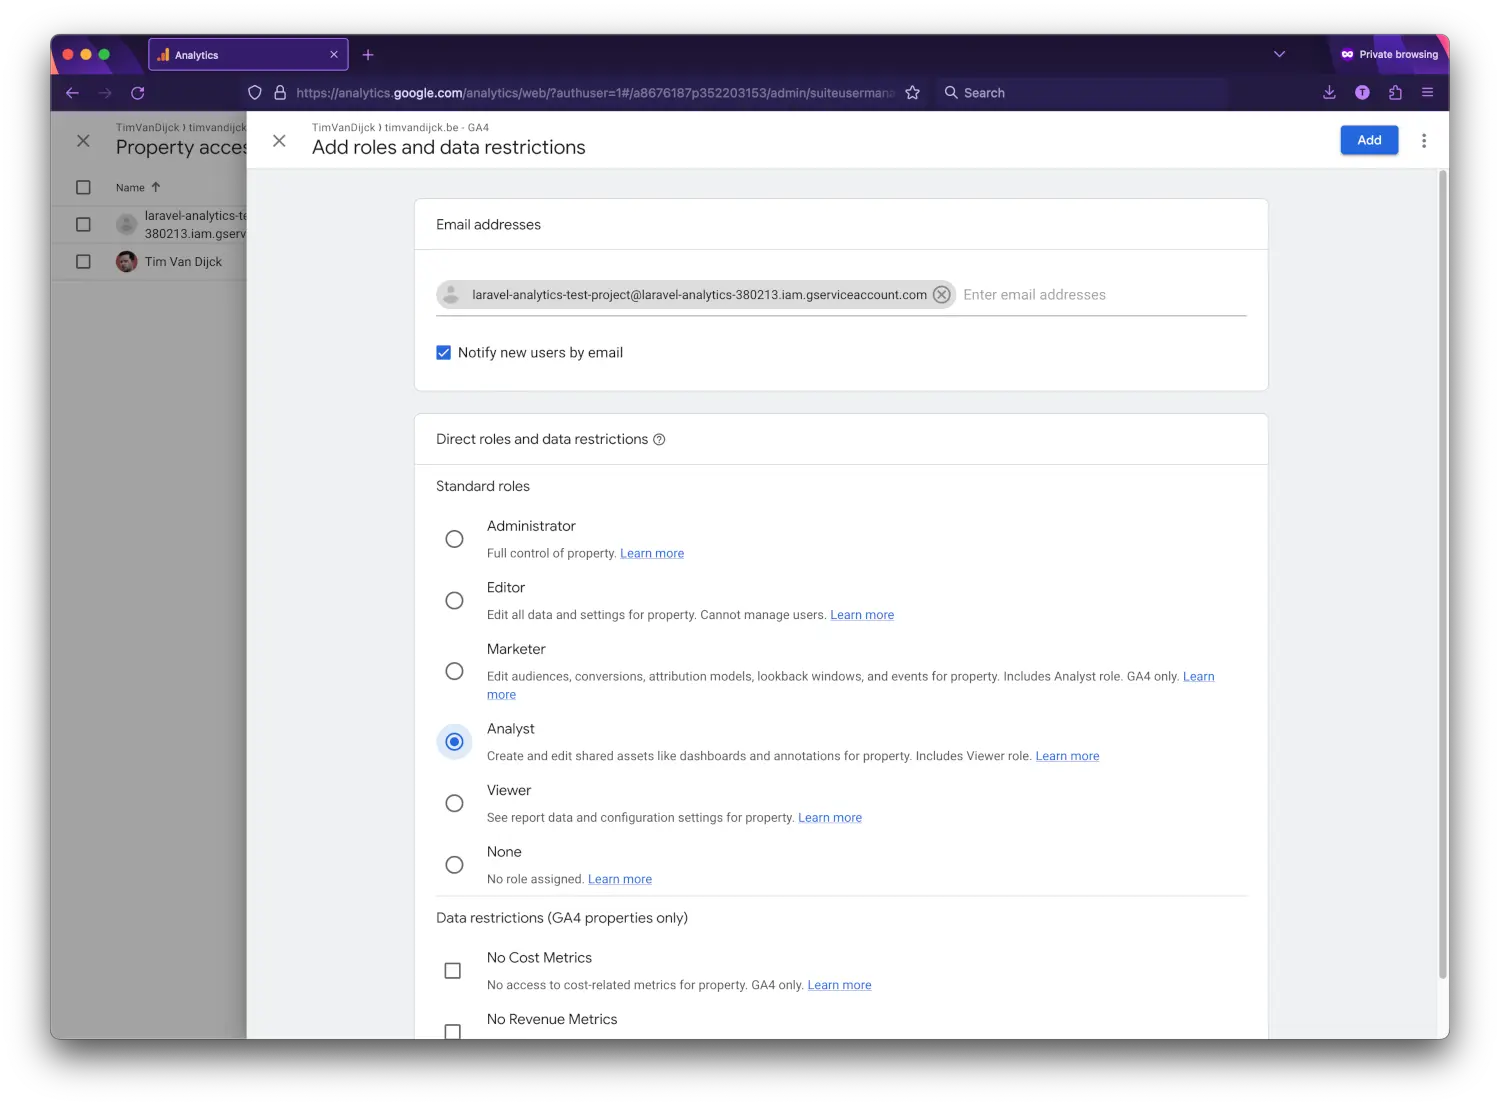
Now we will need to give access to the service account you created. Go to "Property Access Management" in the Admin-section of the property. Click the plus sign in the top right corner to add a new user.
On this screen you can grant access to the email address found in the client_email key from the json file you download in the previous step. Analyst role is enough.
4. Update .env and config/analytics.php
Add to .env:
ANALYTICS_PROPERTY_ID=123456789   # replace with your GA4 property ID
ANALYTICS_SERVICE_ACCOUNT_CREDENTIALS_JSON=storage/app/private/analytics/service-account-credentials.json
5. Test basic connectivity
Create a quick route to test:
// routes/web.php
Route::get('/analytics-test', function () {
    $period = Spatie\Analytics\Period::days(7);
    $topPages = Spatie\Analytics\Facades\Analytics::fetchMostVisitedPages($period);
    return $topPages;
});
Visit /analytics-test. If you get results — good. If error, check:
-
JSON path and permissions
-
Service account added to property access
-
GA4 property ID correct
-
google/apiclientor other dependency issues in composer output
6. Create DashboardController (ready-to-use)
App\Http\Controller\DashboardController:
<?php

namespace App\Http\Controllers;

use Illuminate\Http\Request;
use Carbon\Carbon;
use Spatie\Analytics\Facades\Analytics;
use Spatie\Analytics\Period;
use Illuminate\Support\Collection;
use ConsoleTVs\Charts\Classes\Chartjs\Chart;

class DashboardController extends Controller
{
    // Available date ranges for the filter dropdown
    protected $dateRanges = ['today', 'weekly', 'monthly', 'custom'];

    public function index(Request $request)
    {
        // 1. Get and process the selected date range
        $range = $request->input('date_range', 'weekly');
        list($period, $startDate, $endDate) = $this->getAnalyticsPeriod($request, $range);

        // 2. Fetch all required data from Google Analytics API
        $data = $this->fetchAnalyticsData($period);

        // 3. Prepare Charts
        $charts = $this->prepareCharts($data);

        // 4. Return to the view
        return view('backend.dashboard.index', array_merge($data, [
            'charts'       => $charts,
            'currentRange' => $range,
            'dateRanges'   => $this->dateRanges,
            'startDate'    => $startDate->toDateString(),
            'endDate'      => $endDate->toDateString(),
        ]));
    }

    // --- Helper for Date Filtering ---
    private function getAnalyticsPeriod(Request $request, $range): array
    {
        $startDate = Carbon::today();
        $endDate = Carbon::today();

        switch ($range) {
            case 'weekly':
                $startDate = Carbon::now()->subDays(7)->startOfDay();
                break;
            case 'monthly':
                $startDate = Carbon::now()->subDays(30)->startOfDay();
                break;
            case 'custom':
                $startDate = Carbon::parse($request->input('start_date', $startDate));
                $endDate = Carbon::parse($request->input('end_date', $endDate));
                break;
        }

        $period = Period::create($startDate, $endDate);
        return [$period, $startDate, $endDate];
    }

    // --- Data Fetching Method ---
    private function fetchAnalyticsData(Period $period): array
    {
        // Fetch data in parallel where possible
        $totalVisitorsAndPageViews = Analytics::fetchTotalVisitorsAndPageViews($period);
        $visitsTrend = $this->getVisitsTrend($period);
        $usersTrend = $this->getUsersTrend($period);

        $data = [
            // Info Boxes
            'total_visits' => $totalVisitorsAndPageViews->sum('screenPageViews') ?? 0,
            'total_users'  => $usersTrend->sum('totalUsers') ?? 0,
            'new_users' => $usersTrend->sum('newUsers') ?? 0,
            'bounce_rate' => $this->calculateBounceRate($period),
            'avg_session_duration' => $this->getAvgSessionDuration($period),
            // Charts Data
            'visits_by_day'  => $visitsTrend,
            'top_pages'      => Analytics::fetchMostVisitedPages($period)->take(10),
            'user_countries' => $this->getUserData($period, ['country'])->take(6),
            'top_referrers'  => $this->getTopReferrers($period)->take(5),
            'top_browsers'   => $this->getUserData($period, ['browser'])->take(5),
            'top_devices'    => $this->getUserData($period, ['deviceCategory'])->take(5),
            'visits_and_users_trend' => $this->getVisitsAndUsersTrend($period),
        ];

        return $data;

    }

    // --- Individual Data Fetching Helpers ---

    private function getVisitsAndUsersTrend(Period $period): Collection
    {
        return Analytics::get($period, ['totalUsers', 'screenPageViews'], ['date'])
            ->map(function ($item) {
                return [
                    'date' => $item['date']->format('Y-m-d'),
                    'totalUsers' => $item['totalUsers'],
                    'screenPageViews' => $item['screenPageViews'],
                ];
            });
    }

    private function getVisitsTrend(Period $period): Collection
    {
        return Analytics::get($period, ['screenPageViews'], ['date'])
            ->mapWithKeys(function ($item) {
                return [$item['date']->format('Y-m-d') => $item['screenPageViews']];
            });
    }

    private function getUserData(Period $period, array $dimensions): Collection
    {
        return Analytics::get($period, ['screenPageViews'], $dimensions)
            ->mapWithKeys(function ($item) use ($dimensions) {
                return [$item[$dimensions[0]] => $item['screenPageViews']];
            })
            ->sortByDesc(fn ($views) => $views);
    }

    private function getTopReferrers(Period $period): Collection
    {
        return Analytics::fetchTopReferrers($period);
    }

    private function calculateBounceRate(Period $period): float
    {
        $data = Analytics::get($period, ['bounceRate']);
        return isset($data[0]['bounceRate']) ? round((float) $data[0]['bounceRate'] * 100, 2) : 0.0;
    }

    private function getAvgSessionDuration(Period $period): string
    {
        $data = Analytics::get($period, ['averageSessionDuration']);
        $avgSeconds = isset($data[0]['averageSessionDuration']) ? (float) $data[0]['averageSessionDuration'] : 0;
        return gmdate("H:i:s", (int) $avgSeconds);
    }

    private function getUsersTrend(Period $period): Collection
    {
        return Analytics::get($period, ['totalUsers', 'newUsers'], ['date'])
            ->map(function ($item) {
                return [
                    'date' => $item['date']->format('Y-m-d'),
                    'totalUsers' => $item['totalUsers'],
                    'newUsers' => $item['newUsers'],
                ];
            });
    }

    // --- Chart Preparation Method ---

    private function prepareCharts(array $data): array
    {
        $charts = [];
        $colors = ['#3498db', '#e74c3c', '#2ecc71', '#f1c40f', '#9b59b6', '#1abc9c'];

        // Line Chart: Visits Trend
        $lineChart = new Chart;
        $lineChart->title('Visits Trend Over Time');
        $lineChart->labels($data['visits_by_day']->keys()->all());
        $lineChart->options(['responsive' => true, 'maintainAspectRatio' => false]);
        $lineChart->dataset('Page Views', 'line', $data['visits_by_day']->values()->all())
            ->backgroundColor('rgba(52, 152, 219, 0.2)')
            ->color('#3498db');
        $charts['line'] = $lineChart;

        // Bar Chart: Top 10 Most Visited Pages
        $barChart = new Chart;
        $barChart->title('Top 10 Most Visited Pages');
        $barChart->labels($data['top_pages']->pluck('pageTitle')->all());
        $barChart->options([
            'responsive' => true,
            'maintainAspectRatio' => false,
            'scales' => [
                'xAxes' => [[
                    'ticks' => [
                        'display' => false
                    ]
                ]]
            ]
        ]);
        $barChart->dataset('Page Views', 'bar', $data['top_pages']->pluck('screenPageViews')->all())
            ->backgroundColor($colors);
        $charts['bar'] = $barChart;

        // Bar Chart: Visits by Country
        $countryBarChart = new Chart;
        $countryBarChart->title('Visits by Country');
        $countryBarChart->labels($data['user_countries']->keys()->all());
        $countryBarChart->options([
            'responsive' => true,
            'maintainAspectRatio' => false,
            'scales' => [
                'xAxes' => [['ticks' => ['beginAtZero' => true]]],
                'yAxes' => [['ticks' => ['beginAtZero' => true]]]
            ]
        ]);
        $countryBarChart->dataset('Page Views', 'bar', $data['user_countries']->values()->all())
            ->backgroundColor(array_slice($colors, 0, count($data['user_countries'])));
        $charts['country_bar'] = $countryBarChart;

        // Pie Chart: Top Referrers
        $referrerPieChart = new Chart;
        $referrerPieChart->title('Top 5 Referrers');
        $referrerPieChart->labels($data['top_referrers']->pluck('pageReferrer')->all());
        $referrerPieChart->options(['responsive' => true, 'maintainAspectRatio' => false]);
        $referrerPieChart->dataset('Views', 'pie', $data['top_referrers']->pluck('screenPageViews')->all())
            ->backgroundColor(array_slice($colors, 0, count($data['top_referrers'])));
        $charts['referrer_pie'] = $referrerPieChart;

        // Bar Chart: Top Browsers
        $browserBarChart = new Chart;
        $browserBarChart->title('Top 5 Browsers');
        $browserBarChart->labels($data['top_browsers']->keys()->all());
        $browserBarChart->options([
            'responsive' => true,
            'maintainAspectRatio' => false,
            'scales' => [
                'xAxes' => [['ticks' => ['beginAtZero' => true]]],
                'yAxes' => [['ticks' => ['beginAtZero' => true]]]
            ]
        ]);
        $browserBarChart->dataset('Views', 'bar', $data['top_browsers']->values()->all())
            ->backgroundColor(array_slice($colors, 0, count($data['top_browsers'])));
        $charts['browser_bar'] = $browserBarChart;

        // Doughnut Chart: Top Devices
        $deviceDoughnutChart = new Chart;
        $deviceDoughnutChart->title('Top Devices');
        $deviceDoughnutChart->labels($data['top_devices']->keys()->all());
        $deviceDoughnutChart->options(['responsive' => true, 'maintainAspectRatio' => false]);
        $deviceDoughnutChart->dataset('Views', 'doughnut', $data['top_devices']->values()->all())
            ->backgroundColor(array_slice($colors, 0, count($data['top_devices'])));
        $charts['device_doughnut'] = $deviceDoughnutChart;

        // Line Chart: Visits Trend (Total Visitors vs. Unique Visitors)
        $visitsUsersTrendChart = new Chart;
        $visitsUsersTrendChart->title('Visits Trend: Total vs. Unique Visitors');
        $visitsUsersTrendChart->labels($data['visits_and_users_trend']->pluck('date')->all());
        $visitsUsersTrendChart->options(['responsive' => true, 'maintainAspectRatio' => false]);

        $visitsUsersTrendChart->dataset('Total Visitors', 'line', $data['visits_and_users_trend']->pluck('screenPageViews')->all())
            ->backgroundColor('rgba(52, 152, 219, 0.2)') // Blue
            ->color('#3498db');

        $visitsUsersTrendChart->dataset('Unique Visitors', 'line', $data['visits_and_users_trend']->pluck('totalUsers')->all())
            ->backgroundColor('rgba(231, 76, 60, 0.2)') // Red
            ->color('#e74c3c');
        $charts['visits_users_trend_line'] = $visitsUsersTrendChart;

        return $charts;
    }
}
7. Create Blade (ready-to-use)
Resources/views/backed/dashboard/index.blade.php:
@extends('adminlte::page')

@section('title', 'Google Analytics Dashboard')

@section('content_header')
    <h1>Google Analytics Dashboard ({{ ucfirst($currentRange) }})</h1>
@stop

@section('content')


    {{-- Filtering Form --}}
    <div class="card card-primary">
        <div class="card-header">
            <h3 class="card-title"><i class="fas fa-filter"></i> Filter Data Range</h3>
            <div class="card-tools">
                <button type="button" class="btn btn-tool" data-card-widget="collapse">
                    <i class="fas fa-minus"></i>
                </button>
            </div>
        </div>
        <div class="card-body">
            <form method="GET" action="{{ route('dashboard') }}" class="form-inline">
                @csrf
                <select name="date_range" id="date_range_select" class="form-control mr-2" onchange="this.form.submit()">
                    @foreach ($dateRanges as $range)
                        <option value="{{ $range }}" {{ $currentRange == $range ? 'selected' : '' }}>
                            {{ ucfirst($range) }}
                        </option>
                    @endforeach
                </select>

                @if ($currentRange == 'custom')
                    <div class="d-flex">
                        <input type="date" name="start_date" class="form-control mr-2" value="{{ $startDate }}"
                            required>
                        <input type="date" name="end_date" class="form-control mr-2" value="{{ $endDate }}"
                            required>
                        <button type="submit" class="btn btn-primary">Apply</button>
                    </div>
                @endif
            </form>
        </div>
    </div>

    {{-- Info Boxes --}}
    <div class="row">
        <div class="col-lg-3 col-6">
            <!-- small box -->
            <div class="small-box bg-info">
                <div class="inner">
                    <h3>{{ number_format($total_visits) }}</h3>

                    <p>Total page view</p>
                </div>
                <div class="icon">
                    <i class="fas fa-eye"></i>
                </div>

            </div>
        </div>

         <div class="col-lg-2 col-6">
            <!-- small box -->
            <div class="small-box bg-success">
                <div class="inner">
                    <h3>{{ number_format($total_users) }}</h3>

                    <p>Total users</p>
                </div>
                <div class="icon">
                    <i class="fas fa-users"></i>
                </div>

            </div>
        </div>

        <div class="col-lg-2 col-6">
            <div class="small-box bg-primary">
                <div class="inner">
                    <h3>{{ number_format($new_users) }}</h3>

                    <p>New users</p>
                </div>
                <div class="icon">
                    <i class="fas fa-user-plus"></i>
                </div>

            </div>
        </div>

        <div class="col-lg-2 col-6">
            <div class="small-box bg-warning">
                <div class="inner">
                    <h3>{{ Str::startsWith($avg_session_duration, '00:') ? substr($avg_session_duration, 3) : $avg_session_duration }}
                    </h3>

                    <p>Average session duration</p>
                </div>
                <div class="icon">
                    <i class="fas fa-chart-line"></i>
                </div>
            </div>
        </div>

        <div class="col-lg-3 col-6">
            <div class="small-box bg-danger">
                <div class="inner">
                    <h3>{{ $bounce_rate }}%</h3>

                    <p>Bounce rate</p>
                </div>
                <div class="icon">
                    <i class="fas fa-clock"></i>
                </div>
            </div>
        </div>

    </div>


    {{-- Charts --}}
    <div class="row">
        <div class="col-md-12">
            <div class="card card-lightblue">
                <div class="card-header">
                    <h3 class="card-title"><i class="fas fa-chart-line"></i> Visits Trend</h3>
                    <div class="card-tools">
                        <button type="button" class="btn btn-tool" data-card-widget="collapse">
                            <i class="fas fa-minus"></i>
                        </button>
                        <button type="button" class="btn btn-tool" data-card-widget="maximize">
                            <i class="fas fa-expand"></i>
                        </button>
                    </div>
                </div>
                <div class="card-body">
                    {!! $charts['line']->container() !!}
                </div>
            </div>
        </div>
    </div>

    <div class="row">
        <div class="col-md-6">
            <div class="card card-success">
                <div class="card-header">
                    <h3 class="card-title"><i class="fas fa-list-ol"></i> Top 10 Most Visited Pages</h3>
                    <div class="card-tools">
                        <button type="button" class="btn btn-tool" data-card-widget="collapse">
                            <i class="fas fa-minus"></i>
                        </button>
                        <button type="button" class="btn btn-tool" data-card-widget="maximize">
                            <i class="fas fa-expand"></i>
                        </button>
                    </div>
                </div>
                <div class="card-body">
                    {!! $charts['bar']->container() !!}
                </div>
            </div>
        </div>

        <div class="col-md-6">
            <div class="card card-primary">
                <div class="card-header">
                    <h3 class="card-title"><i class="fas fa-link"></i> Top 10 Most Visited Pages Links</h3>
                    <div class="card-tools">
                        <button type="button" class="btn btn-tool" data-card-widget="collapse">
                            <i class="fas fa-minus"></i>
                        </button>
                        <button type="button" class="btn btn-tool" data-card-widget="maximize">
                            <i class="fas fa-expand"></i>
                        </button>
                    </div>
                </div>
                <div class="card-body">
                    <ol>
                        @foreach ($top_pages as $page)
                            @php
                                $url = $page['fullPageUrl'];

                                // If it doesn't start with http:// or https://, add https://
if (!Str::startsWith($url, ['http://', 'https://'])) {
    $url = 'https://' . ltrim($url, '/');
                                }

                            @endphp

                            <li>
                                <a href="{{ $url }}" target="_blank">{{ $page['pageTitle'] }}</a>
                                ({{ $page['screenPageViews'] }} views)
                            </li>
                        @endforeach
                    </ol>
                </div>
            </div>
        </div>

    </div>

    <div class="row">
        <div class="col-md-6">
            <div class="card card-info">
                <div class="card-header">
                    <h3 class="card-title"><i class="fas fa-globe-americas"></i> Visits by Country</h3>
                    <div class="card-tools">
                        <button type="button" class="btn btn-tool" data-card-widget="collapse">
                            <i class="fas fa-minus"></i>
                        </button>
                        <button type="button" class="btn btn-tool" data-card-widget="maximize">
                            <i class="fas fa-expand"></i>
                        </button>
                    </div>
                </div>
                <div class="card-body">
                    {!! $charts['country_bar']->container() !!}
                </div>
            </div>
        </div>
        <div class="col-md-6">
            <div class="card card-info">
                <div class="card-header">
                    <h3 class="card-title"><i class="fas fa-mobile-alt"></i> Top Devices</h3>
                    <div class="card-tools">
                        <button type="button" class="btn btn-tool" data-card-widget="collapse">
                            <i class="fas fa-minus"></i>
                        </button>
                        <button type="button" class="btn btn-tool" data-card-widget="maximize">
                            <i class="fas fa-expand"></i>
                        </button>
                    </div>
                </div>
                <div class="card-body">
                    {!! $charts['device_doughnut']->container() !!}
                </div>
            </div>
        </div>
    </div>

    <div class="row">
        <div class="col-md-6">
            <div class="card card-warning">
                <div class="card-header">
                    <h3 class="card-title"><i class="fas fa-link"></i> Top 5 Referrers</h3>
                    <div class="card-tools">
                        <button type="button" class="btn btn-tool" data-card-widget="collapse">
                            <i class="fas fa-minus"></i>
                        </button>
                        <button type="button" class="btn btn-tool" data-card-widget="maximize">
                            <i class="fas fa-expand"></i>
                        </button>
                    </div>
                </div>
                <div class="card-body">
                    {!! $charts['referrer_pie']->container() !!}
                </div>
            </div>
        </div>

        <div class="col-md-6">
            <div class="card card-danger">
                <div class="card-header">
                    <h3 class="card-title"><i class="fab fa-chrome"></i> Top 5 Browsers</h3>
                    <div class="card-tools">
                        <button type="button" class="btn btn-tool" data-card-widget="collapse">
                            <i class="fas fa-minus"></i>
                        </button>
                        <button type="button" class="btn btn-tool" data-card-widget="maximize">
                            <i class="fas fa-expand"></i>
                        </button>
                    </div>
                </div>
                <div class="card-body">
                    {!! $charts['browser_bar']->container() !!}
                </div>
            </div>
        </div>
    </div>

    <div class="row">
        <div class="col-md-12">
            <div class="card card-info">
                <div class="card-header">
                    <h3 class="card-title"><i class="fas fa-chart-line"></i> Visits Trend: Total vs. Unique Visitors</h3>
                    <div class="card-tools">
                        <button type="button" class="btn btn-tool" data-card-widget="collapse">
                            <i class="fas fa-minus"></i>
                        </button>
                        <button type="button" class="btn btn-tool" data-card-widget="maximize">
                            <i class="fas fa-expand"></i>
                        </button>
                    </div>
                </div>
                <div class="card-body">
                    {!! $charts['visits_users_trend_line']->container() !!}
                </div>
            </div>
        </div>
    </div>
@stop

@push('js')
    <script src="https://cdnjs.cloudflare.com/ajax/libs/Chart.js/2.7.1/Chart.min.js" charset="utf-8"></script>
    {!! $charts['line']->script() !!}
    {!! $charts['bar']->script() !!}
    {!! $charts['country_bar']->script() !!}
    {!! $charts['referrer_pie']->script() !!}
    {!! $charts['browser_bar']->script() !!}
    {!! $charts['device_doughnut']->script() !!}
    {!! $charts['visits_users_trend_line']->script() !!}

    <script>
        // Show/hide custom date fields based on selection
        document.getElementById('date_range_select').addEventListener('change', function() {
            if (this.value !== 'custom') {
                this.form.submit();
            }
        });
    </script>
@endpush
7. Create Route
Route/web.php:
Route::get('dashboard', [App\Http\Controllers\DashboardController::class, 'index'])->name('dashboard');
8. Security & production checklist
-
NEVER commit the service account JSON to git.
-
Keep
storage/out of public access and appropriately permissioned. -
Use Laravel cache driver (redis/memcached) for production to reduce API calls.
-
Respect Google API quotas and use caching (
cache_lifetime_in_minutes).
9. Final checklist (before deploying)
-
Service account JSON in
storage/app/private/analytics/ -
.envvalues set (ANALYTICS_PROPERTY_ID) -
config/analytics.phppoints to storage path -
Service account added to GA property with Analyst role
-
Composer packages installed & updated
-
Controller & Blade present, route registered
-
Caching configured for production
🎉 Congratulations — Your Job Is Done!
You’ve successfully integrated Google Analytics (GA4) into your Laravel Dashboard!
Now, your admin panel can show real-time insights like top pages, active users, traffic sources, and more — all within your Laravel app.
Your setup now includes:
✅ Secure Service Account connection
✅ Spatie Analytics integration
✅ Interactive charts with Chart.js
✅ Cached analytics data for performance
You’ve built a professional, data-driven dashboard — great work! 🚀
💼 Need a Custom Website or Dashboard Like This?
If you want to develop a custom website, Laravel dashboard, or analytics integration for your business — our team at Vfix Technology can help you build it from scratch or optimize your existing project.
📱 WhatsApp: https://wa.me/918447525204
📞 Call (India): +91 8447 525 204
Let’s turn your next idea into a powerful digital product!
Tags
Share :